Data Management
HyperStudy provides comprehensive tools for accessing, managing, and downloading your experiment data. You can use the graphical interface for quick viewing and downloads, or access data programmatically through the API for automated analysis.

Accessing the Data Dashboard
For Experimenters
- Log in to your experimenter account
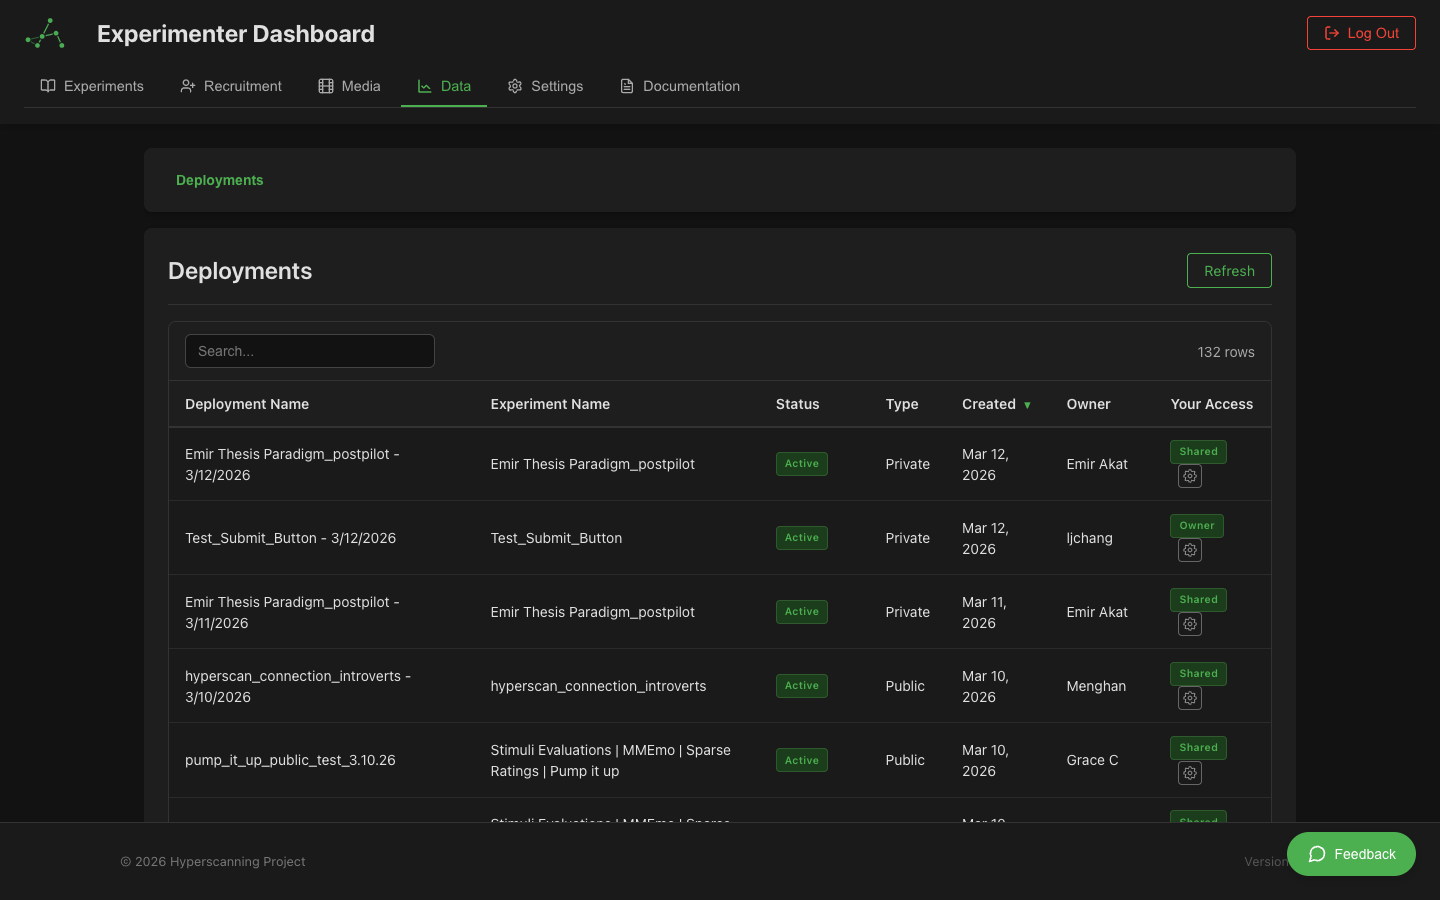
- Navigate to your Experimenter Dashboard
- Click on the Data tab in the sidebar
- You'll see a list of your deployments that have collected data
For Administrators
- Log in to your administrator account
- Navigate to the Admin Dashboard
- Select Data Management from the menu
- You'll have access to data from all deployments on the platform
Navigating the Interface
The data management interface uses a hierarchical structure:
Deployments → Rooms → Participants → Data
Breadcrumb Navigation
A breadcrumb trail at the top shows your current location and allows quick navigation:
Data > Deployment Name > Room Name > Participant ID
Click any level in the breadcrumb to navigate back to that view.
View Modes
The interface supports two view modes (toggle in the top-right):
- Rooms view: Navigate Deployments → Rooms → Participants → Data (the default hierarchical path)
- Participants view: Navigate Deployments → All Participants → Data (skips the room level for a flattened view)
1. Deployments Table
The top-level view shows all deployments you have access to:
- Deployment Name: Click to drill down into rooms or participants
- Status: Active, completed, archived
- Participant Count: Total participants across all sessions
- Created Date: When the deployment was created
Legacy experiments without deployments also appear here for backward compatibility.
2. Rooms Table
After selecting a deployment, you'll see all rooms (sessions):
- Room ID: Unique identifier for each session
- Participant Count: Number of participants in this session
- Status: Active, completed
- Start Time: When the session began
- Duration: How long the session lasted
Actions: Click any room to view participants. Click Download All to export all data for this room.
3. Participants Table
After selecting a room, you'll see all participants:
- Participant ID: Unique participant identifier
- Role: Their assigned role in the experiment
- Status: Completed, active, disconnected
- Data Available: Which data types are available
Actions: Click any participant to view their data. Click Download All for bulk export.
4. Data Viewer
After selecting a participant, a tabbed interface shows all their data.
Data Types
Events
All participant interactions and system events:
- Component Events: Button clicks, form submissions, rating inputs
- State Transitions: Moving between experiment states
- Media Events: Video play/pause, audio recording start/stop
- Timing Information: Precise timestamps and onset times
Key Fields:
| Field | Description |
|---|---|
timestamp | Absolute time of event (ISO 8601) |
onset | Milliseconds from experiment start (can be negative) |
eventType | Type of event (e.g., component.complete) |
componentType | Which component generated the event |
content | Human-readable description |
response | Participant's response data (if applicable) |
Recordings
Video and audio recordings from LiveKit video chat:
| Field | Description |
|---|---|
recordingId | Unique identifier for the recording |
participantId | Who was recorded |
startTime / endTime | Recording time window |
duration | Length in milliseconds |
downloadUrl | Signed URL to download the file |
videoOffset | Offset from experiment start |
Recordings are stored in cloud storage with time-limited access URLs. Download recordings for archival purposes.
Text Chat
Messages sent through the text chat component:
| Field | Description |
|---|---|
messageId | Unique message identifier |
senderId | Who sent the message |
content | Message text |
timestamp | When sent |
recipientIds | List of recipients |
Video Chat
Metadata about video chat sessions including connection events, track publications, and quality metrics.
Continuous Ratings
Real-time rating data from continuous rating components. Data points are recorded every 100-500ms while rating.
| Field | Description |
|---|---|
timestamp | When rating was recorded |
value | Rating value (normalized or raw) |
componentId | Which rating component |
onset | Time from experiment start |
Sparse Ratings
Individual rating responses from VAS, Likert scales, and similar discrete-response components.
| Field | Description |
|---|---|
value | Rating value |
responseTime | Time taken to respond |
componentId | Which rating component |
labels | Scale labels (if applicable) |
Sync Metrics
Video synchronization quality data (multi-participant experiments only):
| Field | Description |
|---|---|
timestamp | When measured |
timeDrift | Difference from host (milliseconds) |
playbackRate | Current playback speed adjustment |
syncQuality | Quality metric (0-1) |
Quality Indicators:
- Green (< 100ms drift): Excellent sync
- Yellow (100-500ms drift): Acceptable sync
- Red (> 500ms drift): Poor sync, may affect data quality
Components
Metadata about experiment components: configuration, which state each component appeared in, and variable values at display time.
Questionnaire
Post-experiment questionnaire responses including question text, participant answers, and response timestamps.
Comprehension
Comprehension check results from instruction pages, including questions presented, answers given, scores, and pass/fail status.
Filtering and Search
Event Type Filtering
Use the dropdown to filter events by category (Component Events, State Events, Media Events, etc.). The table and event count update to show only matching events.
Column Filtering
Click Show Filters to reveal filter inputs on each column. Filters work across all columns simultaneously with partial text matching.
Sorting
Click any column header to sort ascending, descending, or remove sort.
Export Options
Download Levels
You can download data at multiple levels of the hierarchy:
| Level | What's Included |
|---|---|
| Individual Data Type | Single tab for one participant |
| All Data for a Participant | All data types for one participant |
| All Data for a Room | All participants in a session |
| All Data for a Deployment | All rooms and participants |
Export Formats
| Format | Best For | Notes |
|---|---|---|
| CSV | Excel, R, SPSS, SAS | Flattened structure, UTF-8 with BOM for Excel |
| JSON | Python, JavaScript | Preserves nested structure and data types |
| ZIP | Bulk downloads | Combines multiple data types with metadata file |
Contextual Exports
Exports respect any active filters, so you can narrow down to specific event types or time ranges before downloading.
For large datasets, a progress modal shows download status with a cancel option.
Timestamps and Onset Times
All events include two time representations:
-
Absolute Timestamp (
timestamp): ISO 8601 format (e.g.,2024-10-20T14:30:45.123Z). Use for cross-referencing with external systems. -
Onset Time (
onset): Milliseconds from experiment start. Can be negative for events before the experiment officially started (e.g., setup/consent events). Use for aligning events and analyzing timing patterns.
Data Privacy and Access Control
Data access is controlled through the Permissions & Sharing system:
- Experiment Owner: Full access to all data
- Deployment Owner: Full access to data from their deployment
- Collaborators: View/export permissions as configured
- Administrators: Platform-wide access (all access is logged)
Data permissions are managed separately from experiment design permissions. See Data Permissions for details.
Data resources cannot be made public. All data access must be explicitly granted.
Programmatic Access via API
For automation, batch processing, or custom analysis, use the HyperStudy API:
- Generate an API Key — See API Key Management
- Choose Your Language — Python | JavaScript | R
- Learn the Endpoints — API Overview | Data Types & Endpoints
Best Practices
- Download regularly during data collection — don't wait until the end
- Keep multiple backups in different locations
- Use the API for very large datasets or repeated exports
- Follow IRB requirements for data handling, storage, and participant consent
- Organize downloads with consistent folder structures and analysis scripts
Troubleshooting
| Problem | Solution |
|---|---|
| Download fails | Try smaller date ranges; check browser console for errors |
| Data missing | Verify session completed; check filters; ensure sync completed |
| Export timeout | Use API for very large datasets; download in smaller chunks |
| File won't open | Check file extension matches format; try different software |
| Slow loading | Filter to smaller dataset; use pagination; consider API access |
| Missing recordings | Verify participant granted camera permissions; check recording status |
| Sync metrics missing | Normal for single-participant sessions — sync is only for multi-participant |
If issues persist, contact support with the experiment/deployment ID, what you were trying to download, and any error messages.